
Climate Change and Flood Assesment : A Future towards NWP
case study: Ethiopian
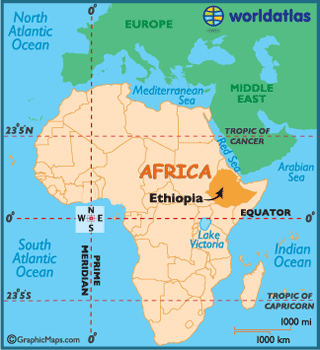
i. Country description
-
Ethiopia is in the tropical zone lying between the Equator and the Tropic of Cancer proximally 3°-15°N latitude and 33°-48°E longitude.
-
Ethiopia is dominated by a vast highland complex of mountains, plateaus and lakes, all divided by the Great Rift Valley that's surrounded by lowlands and stepp
-
The highest point of Ethiopia is Ras Dejen at 14,928 ft (4,550 m); the lowest point of the country is the Afar Depression at 410 ft (125 m)
-
The climate of Ethiopia is mainly controlled by the seasonal migration of the inter tropical convergence zone (ITCZ) and associated atmospheric circulations as well as by the complex topography of the country.
-
It has three different climate zones according to the elivation
-
Mean annual rainfall distribution has maxima (>2000 mm) over the Southwester highlands and minima (<300 mm) over the Southeaster & Northeaster lowlands
 |  |  |
|---|
ii.Season of Ethiopia
the rainfall pattern is charachterized in four season.
note :in some books we may get only the three sesons,but it differs place to place
-
Kiremt or Meher (Summer) - June, July and August are the summer season. Heavy rain falls in these three months.
-
Belg (Autumn) - September, October and November are the spring season sometime known as the harvest season.
-
Bega (Winter) - December, January and February are the dry season with frost in morning specially in January.
-
Tseday (Spring) - March, April and May are the autumn season with occasional showers. May is the hottest month in Ethiopia.
iii.flood type in Ethiopia
-
Flood – one of the major natural hazards in Ethiopia – affects lives and livelihoods in parts of the country. Flooding in Ethiopia is mainly linked with torrential rainfall and the topography of the highland mountains and lowland plains with natural drainage systems formed by the principal river basins.
-
Flooding is inevitable in some areas of Ethiopia during the main rainy season, which extends from June to September; the season is characterized by high volumes of rain widely distribution
-
In most cases floods occur in the country as a result of prolonged heavy rainfall causing rivers to overflow and inundate areas along the river banks in lowland plains Flash floods occur in lowland areas when excessive rains fall in adjacent highland areas. Among the major river flood-prone areas Awash River is the one,
-
Frequency and magnitude have increased rapidly in the last few decades. Large-scale irrigated agriculture of the country is concentrated along the Awash River. Irrigation development in this river basin is quite advanced and is located in the flood plains on either side of the Awash River.
-
Therefore, high economic damage occurs during flooding along this riverIt is estimated that in the Awash Valley, almost all of the area (200,000 - 250,000 ha) delineated for irrigation development is subjected to flood during high flows of the river (Kefeyalew, 2003)
study area
 |  |  |
|---|---|---|
 |
iv. cause of flood in the study area
-
The rise of the riverbed due to silting is causing the Awash River to overflow in places where it never used to overflow.
-
The dykes constructed to protect cropped farm land in the vicinity of the riverbed were not strong and high enough
-
Intense rainfall in the highlands causes flooding of settlements close to any stretch of river courses
-
Torrential rains, common during the rainy season, cause sudden rise in the flow of these streams, which bring about flood damages to settlements along their banks.
v. influence of flood in Ethiopia
For communities living in the lowland areas the result is one of growing vulnerability to sudden and potentially catastrophic flooding when the river inevitably breaks through the increasingly unstable dykes.
Economically
During floods (especially flash floods), roads, bridges, farms, houses and automobiles are destroyed
Environment
The environment also suffers when floods happen. Chemicals and other hazardous substances end up in the water and eventually contaminate the water bodies that floods end up in
People and animals
Many people and animals have died in flash floods. Many more are injured and others made homeless. Water supply and electricity are disrupted and people struggle and suffer as a result. In addition to this, flooding brings a lot of disease
 the infulence of flood Flood in awash region |  the influence of flood in human and animal life,economic and in environment source: google image |  economical effect of flood |
|---|
vi.Discussion in the analysed data
The rainfall data used for this analysis, obtained from the Ethiopian NMA ,are monthly totals,among them we select one staion becasuse ti had full data no missing datas.its dubti station,dubti is lacated latitude and longitude of a latitude and longitude of 11°44′N 41°05′ECoordinates: with an elevation of 378 meters above sea level.
28 years (1986-2014) data were analysed to show the rainfall distribution in 48 years and which monthly average rainfall amount may lead to flood in Awash .
The 28 years data were plotted using both R and Excel to show monthly rainfall variability and the probability of excedence of annual rainfall as shown in the figures below
It was found that the months to get high amount of rainfall are july and augest during the long rainy season, as well as march and april during short rainy season,with a monthly average rainfall amount variating between 100 to 300mm
 this graph shows tha The monthly rainfall in Gewane from(1986-2014) thy got the maximum amount of rainfall during July and august in the main rainy seson and also they got high amount of rainfall during march and February the second rainy season for the area in most of the years data source:NMA |  graph 2 shows that The annual rainfall for Gewane starting from 1986-2014 show that in all year the area got above 200mm rainfall annually. In 1990,1998 and 2010 the area get above 600mm rainfall per year data source:NMA |  this graph shows us the rainfall distribution in gewane .it helps us to get the maximum and minimum rainfall.the maximum rainfall is in July and august also thy receive minimum rainfall during the dray seasons(October,November ,December and January. data source:NMA |
|---|